Reporting and analytics
Run progress, pass rate, release-over-release trends, contribution per person. Quality status is visible without asking the team for an update.
Dashboards and widgets
A dashboard is assembled from widgets for whoever is looking at it: a test lead needs team workload, a manager needs release trends.
- Widgets are added and rearranged to fit the job
- Run progress and pass rate
- Trends across releases and contribution per person
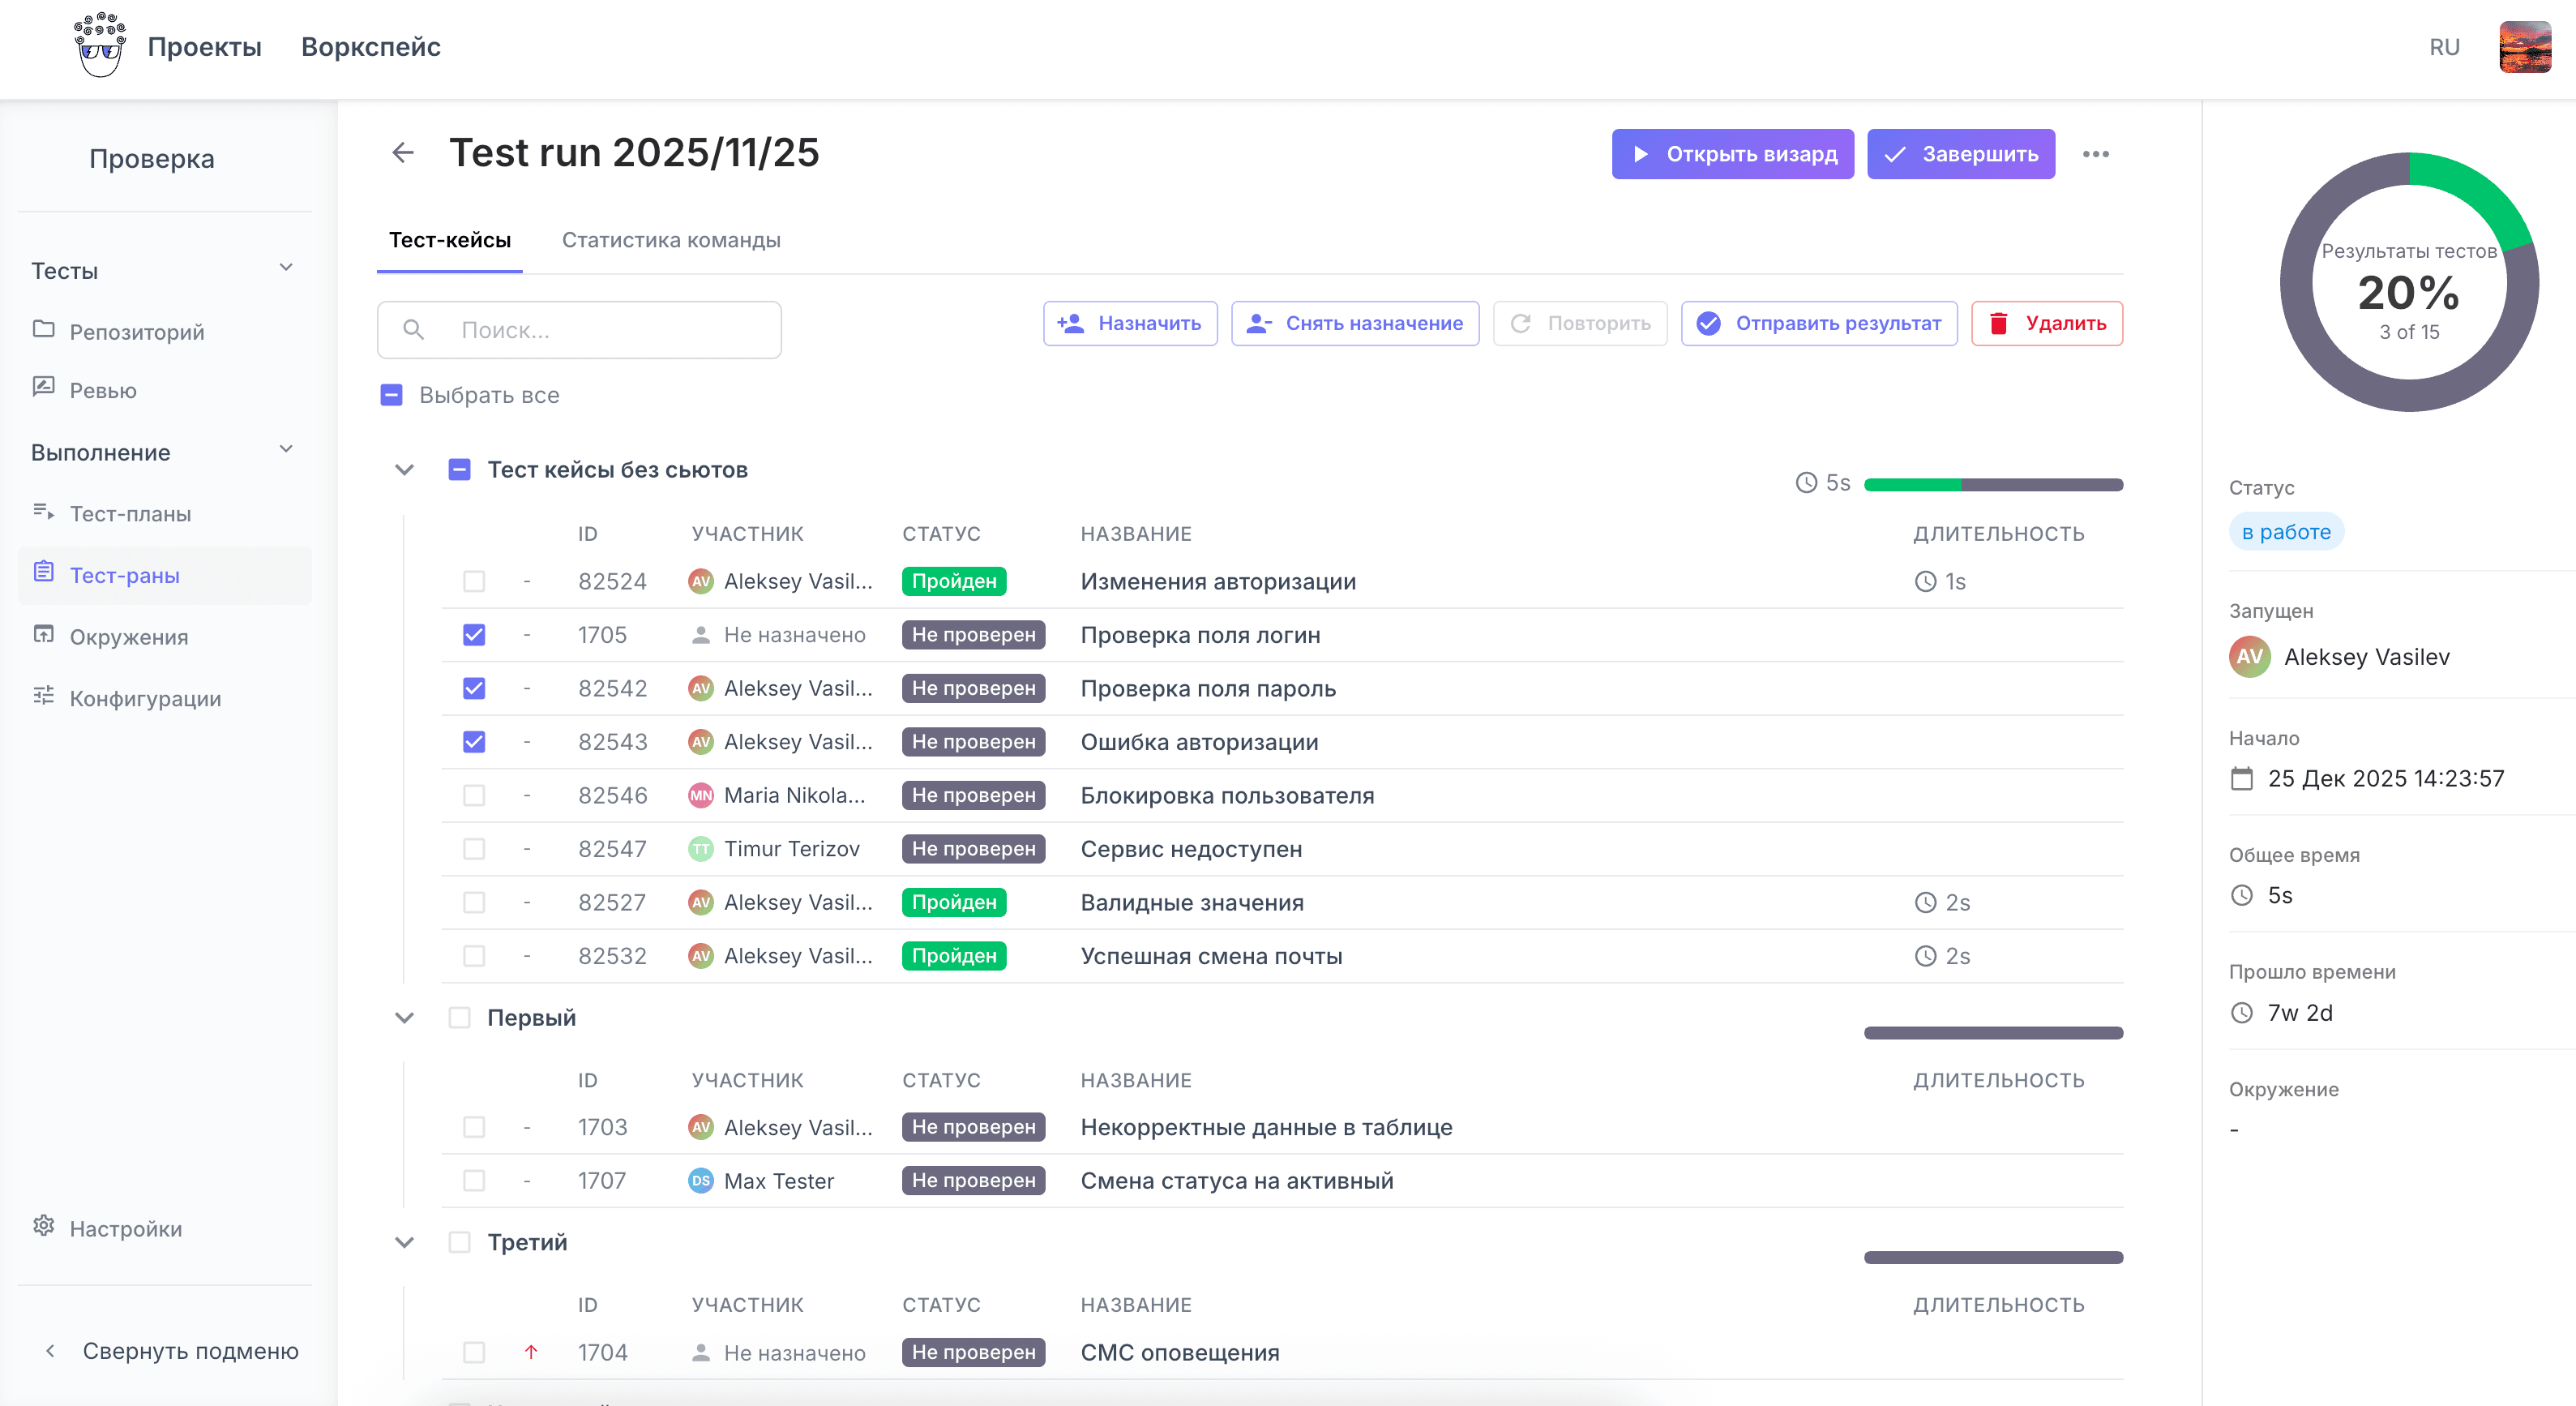
Run reports
A report is built from a run and answers the question «can we ship», not «how many cases were executed».
- A breakdown by status and by suite
- What failed, on which environment and in which configuration
- Attachments and comments stay next to the result
A public link to a report
A report opens by link with no sign-in. A client, a manager or a neighbouring team does not need an account to see the outcome of a run.
- The link is sent by email or into a work chat
- The viewer sees the report and does not get inside the system
- No spreadsheet export and no reassembling it by hand
Related sections
Show the report to the people waiting for it
Execute one run and send the report link. The question «how are we doing on tests» usually stops coming after that.